2024 Children & Youth Report Card

Share the Report Card


What is the Children and Youth Report Card?
What is the relationship between climate change and kids’ physical activity?
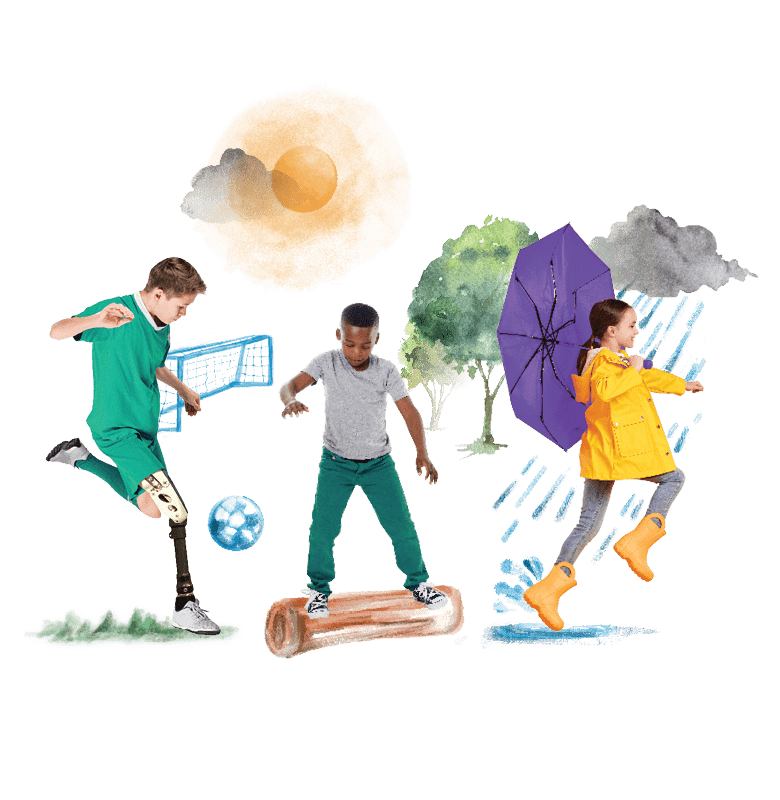
With the number of annual weather alerts in Canada having more than doubled in the past 10 years,1 it’s time for Canada to recognize the impacts of a changing climate as an added barrier to getting children and youth active where they live, learn and play. Unfavourable weather and climate conditions such as heatwaves, heavy rain and smoke-filled air can lead to recesses and outdoor sport and recreation activities being cancelled, and more time spent indoors being sedentary with increased exposure to screens.
With overall physical fitness having a direct impact on heat tolerance,2 it’s possible that kids being less fit than ever before could also impact their ability to acclimate to and tolerate the rising temperatures of a changing climate. Further, given that children cannot regulate their temperature in extremely hot and cold climates as well as adults can,2 this puts them at greater health risk in extreme temperatures before physical fitness levels are even taken into account.
Physical activity can help mitigate the negative health impacts of climate change, and combined efforts from multiple sectors and people are needed to get and keep children and youth physically active in a changing climate – inside and outside, rain or shine. By rallying for resilience, Canada can begin to future-proof the next generation.
Overall Physical Activity Grade
39% of children and youth (five to 17 years) in Canada met the recommendation of 60 minutes of moderate- to vigorous-intensity physical activity per day.


24-Hour Movement Behaviours
4% of children and youth (five to 17 years of age) met the combined 24-Hour Movement Guidelines.

43% of parents indicated that their children and youth (five to 17 years of age) either solely commuted actively to or from school or commuted partially in an active way in combination with non-active modes of transportation.

Community & Environment
70% was the average score reported across the areas of policies, human resources, facilities and infrastructure, partnerships, and programming specific to physical activity for children, youth and families.

Government
68% was the average score reported across the following six areas specific to physical activity: number and range of relevant policies; supporting actions; accountable organization(s); reporting structures; funding; and monitoring and evaluation plans.

Tools and resources
Coordinated efforts from multiple sectors and people are needed to get and keep children and youth physically active in a changing climate. Below are key recommendations and tools to help government, schools and educators, parents and guardians, and individuals activate Report Card findings:
“The Report Cards on Physical Activity have been influential in creating awareness, assisting with public health surveillance, forcing accountability, facilitating advocacy, influencing policy, and identifying jurisdictional strengths, weaknesses and priorities for action. The impact of the Report Cards over the past 19 years has been remarkable, far exceeded our initial goals and shows no signs of slowing down!”
Dr. Mark Tremblay
Children and Youth Report Card Chief Scientific Officer
1. Who developed the 2024 Report Card?
2. Can you explain the methodology behind the research?
The Report Card Research Committee identifies and assesses Report Card indicators to determine grade assignments based on the best-available data, research and key issue areas from the past few years, all of which are included in the full Technical Report Card. Grade assignments are determined based on examination of the current data and literature for each indicator against a benchmark or optimal scenario, assessing the indicator as an:
A (80-100%) = We are succeeding with a large majority of children and youth.
B (60-79%) = We are succeeding with well over half of children and youth.
C (40-59%) = We are succeeding with about half of children and youth.
D (20-39%) = We are succeeding with some but less than half of children and youth.
F (0-19%) = We are succeeding with very few children and youth.
3. Where can I find information about children zero to four years of age?
Data on preschoolers (three- to four-year-olds) are no longer factored into the letter grades because preschoolers have different benchmarks compared to children and youth (five- to 17-year-olds), and this difference is not easily resolved simply by weighting the data by age group (as was done in previous Report Cards). To summarize the best-available data on the early years (zero to four years), findings related to select indicators are outlined in “Getting a Head Start: Physical Activity in the Early Years (Zero to Four Years)” in the Technical Report Card (see pages 77 to 78).
4. What can I do to help improve physical activity levels among children and youth in Canada?
Getting kids moving more and more often can be an individual and/or communal effort. Recommendations on how many sectors and people, including parents/support networks, schools/educators and communities/politicians can help kids face adversity, move more and build resilience can be found throughout the Report Card.
Download the Highlight Report Card.
Download the full Technical Report Card.
5. How can I support the launch of the Report Card?
You can share the Report Card with your network/friends/family. Here is a link to our Communications Toolkit, which includes social media posts, images, email templates and more to help you share the Report Card. You are also welcome to print copies of it if your at-home or at-office resources allow you to do so. If sharing on social media, don’t forget to tag us @ParticipACTION.
Do you have questions that were not answered in the FAQ?
Email:
Email us at info@participaction.com.
For media inquiries, please contact: fsimon@getproof.com
- Environment and Climate Change Canada. (2023). Canadian Environmental Sustainability Indicators: Temperature change in Canada. Consulted on Mar 7, 2024. Available at: canada.ca/en/environment-climate-change/services/environmental-indicators/temperature-change.html
- Foster J, Hodder SG, Lloyd AB, Havenith G. (2020). Individual responses to heat stress: Implications for hyperthermia and physical work capacity. Frontiers in Physiology,11:541483.


